Google Analytics:Getting to Know Your Users
As a website owner, blogger, or anyone who has a web presence you want to know if your webpage content, products or services are reaching your intended audience or any audience at all. In the digital age, it is much easier to collect data on marketing campaigns to gauge success, what users are reviewing your website, how long they stay on a website, and how users find products and services on the internet thanks to Google Analytics.
Google Analytics is a “web analytics service offered by Google that tracks and reports website traffic, currently as a platform inside the Google Marketing Platform brand”. Businesses, company’s and organizations around the world use google analytics to collect data on website traffic. A powerful data tracking tool that collects demographic data, user session duration, bounce rates, conversations, acquisitions, and so much more. The significance of such data can impact a business’s bottom line, help leaders make informed decisions about online presence, or even help bloggers, or soon to be developers and or designers drive traffic to their webpages by replicating successful posts, articles or media with users. This post is committed to using Google Analytics to identify the data of users who have interacted with my User Research Journal.
Identifying Data Metrics
The Data metrics used for the User journal Evaluation include for review include:
- Audience: Google Analytics classifies audience data into 15 different categories. The categories for audience evaluation include behavior, technology, and mobile.
- Acquisition: Google Analytics classifies acquisition data into 5 categories. The categories used for this evaluation are all traffic- channels tree maps and referrals.
Questions and Data for Consideration
While conducting the evaluation of the usability Journal the data for the following questions are being collected.
- Demographics: Where are my users geographically located?
- Behavior: How many of my users are new or returning?
- Technology: What kind of browser and networks are visitors using?
- Mobile: What type of device are visitors using?
- Channels: How are website users getting to the User Experience journal?
- Referrals: What websites are users using to get to the User Experience Journal?
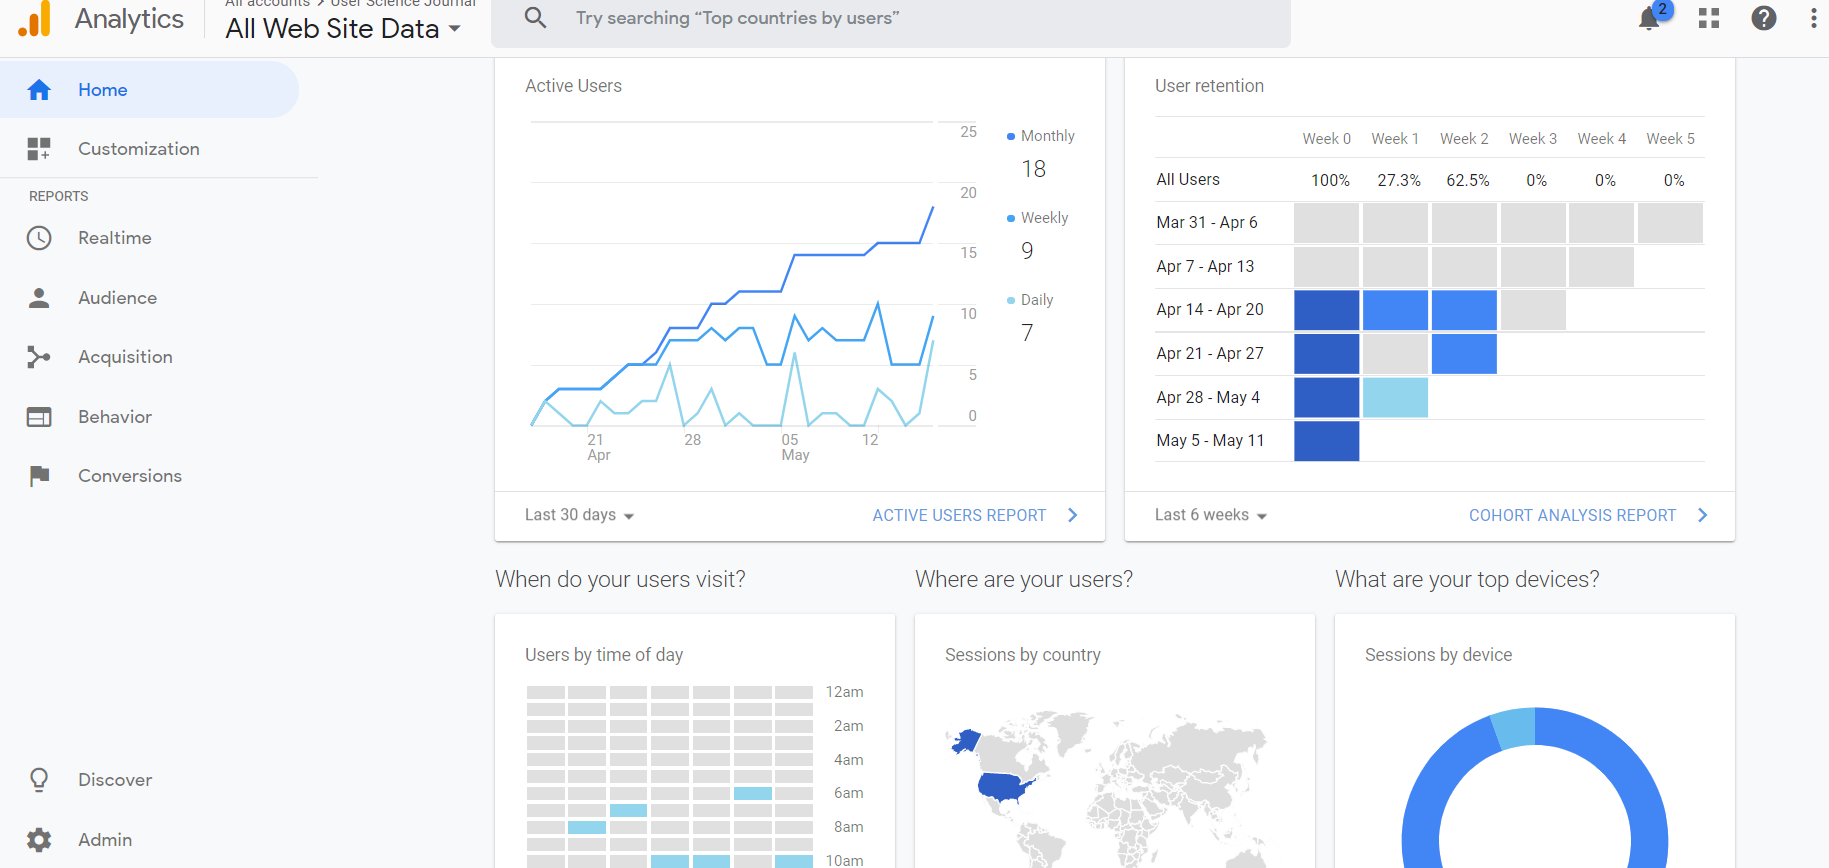
- Demographics: User Science Journal users are located in Seattle Washington. The User Experience Journal is a project developed for educational purposes for Seattle University. As a result, the users are most likely cohort peers located in Seattle, Washington.
- Behavior: All of the users are new, view the page once, for 10 minutes or less. The development of the User Journal started in April with the users most likely being cohort peers who viewed the page for content review for academic purposes for a brief moment with little interest beyond reviewing the page for class purposes.
- Technology: Users are most likely using Chrome, Firefox, or Explorer to view the User Science Journal as they have three of the most popular browsers.
- Mobile: Users are using desktop devices to view Usability Journal. The usability journal is viewed from using canvas for academia referred from the canvas website. I’m predicting the users aren’t using mobile devices, or tablets to view course content which is my predicted referral source leaving desktops as the primary device to access the User Science Journal.
- Channels: Users are using direct link to Canvas, Githubio, or twitter to view the User journal. The User Journal was developed for academic purposes, connected to a university course that uses Canvas, and Github to communicate with students. The User experience Journal was posted on Twitter. Users are not using a search option to find the Usability Journal.
- Referrals: Users are using canvas.org and github.com to view the Usability Journal.
- Demographics:Where are Users located?
- Behavior: Are the User Journals New or Returning visitors?
- Technology: What device did Users use to view the Journal?
- Channels:How did Users get to the User Journal?
- Referrals: What websites are users using to get to the User Experience Journal?
Predictions
The audience and acquisition data hypothesis are as follows :
Actual Data for User Experience Journal
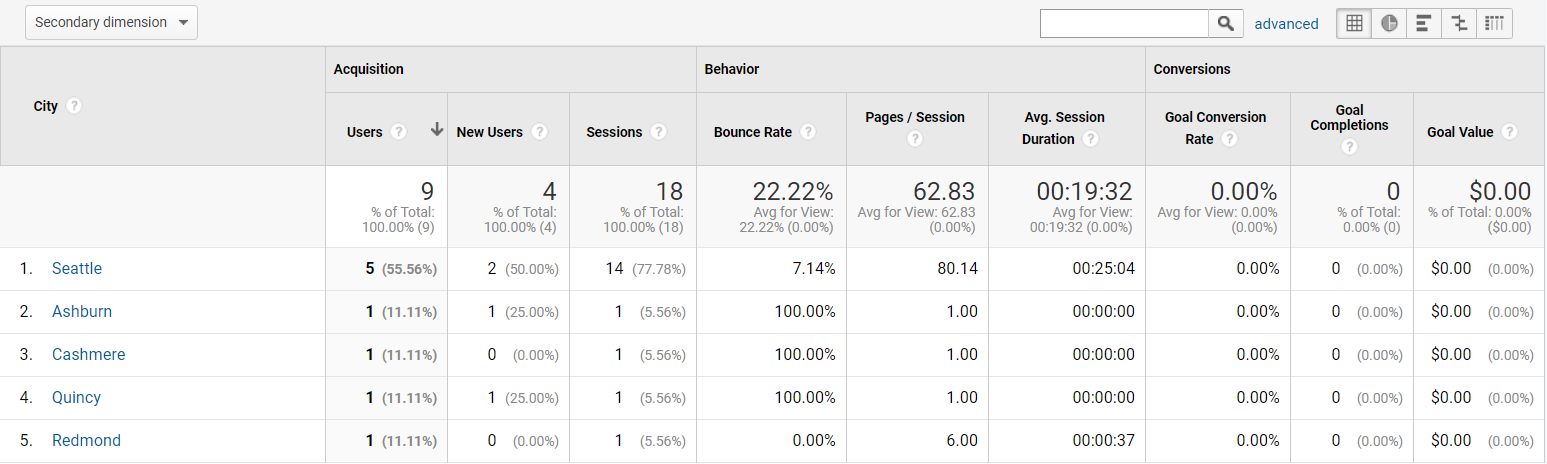
As predicted many of the users that viewed the User Science Journal where located in the Seattle Area.A review of the data reveals that users are located in differnt cities in the seattle area. 55.6% of the users were located in the Seattle area, while there was an even 11.1% percent distribution of users from four addditional locations- Cashmere, Quincy , Redmond, and Ashburn.
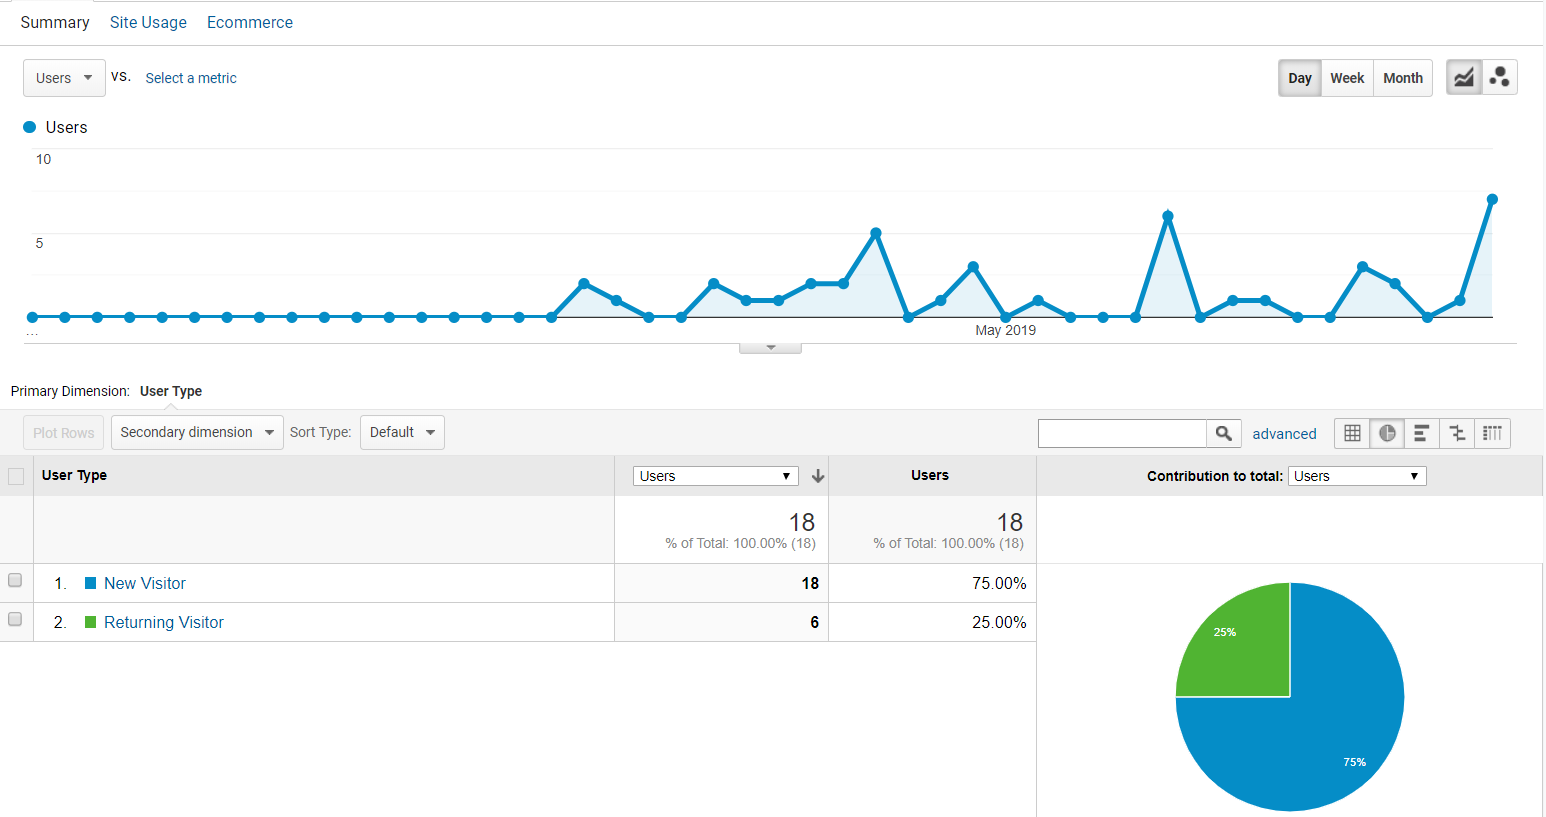 25% of users are returning visitors
The actual data for the user data is differnt than the predicted data. The actual results reveal that 75% of the users visiting the User journal are new and 25% are returning. Meaning that there was a percentage of users who previously visited the site and found the journal interesting enough to view return to the User Journal.
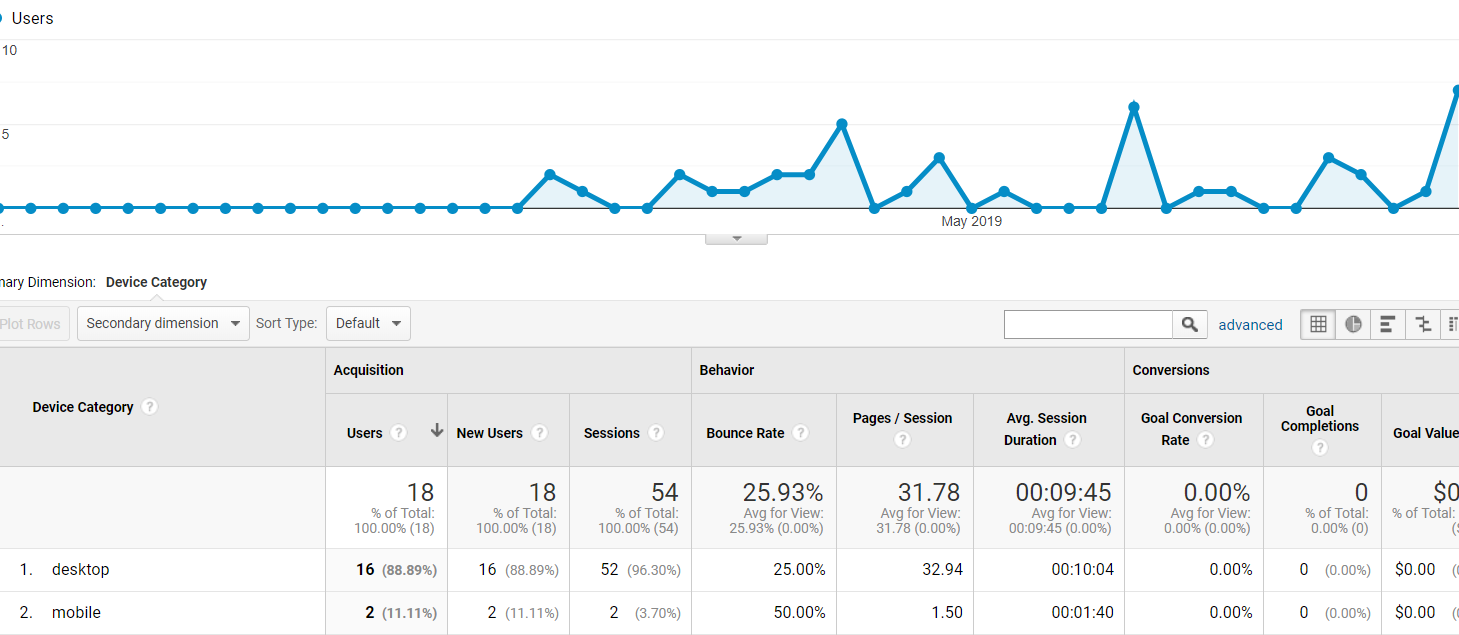 The majority of users used a desktop device
The actual data for devices is close to the predicted data. The predicted data anticipated that based on the context of the journal users would most likely attract desktop users, though the correlation requires sometesting. There are two mobile device users, interstingly enough the bounce rate for mobile users is much higher than desktop users as desktop users stayed on the user journal 9 minutes longer than mobile users but on everage as predicted users didnt stay on the user journal longer than 10 minutes.
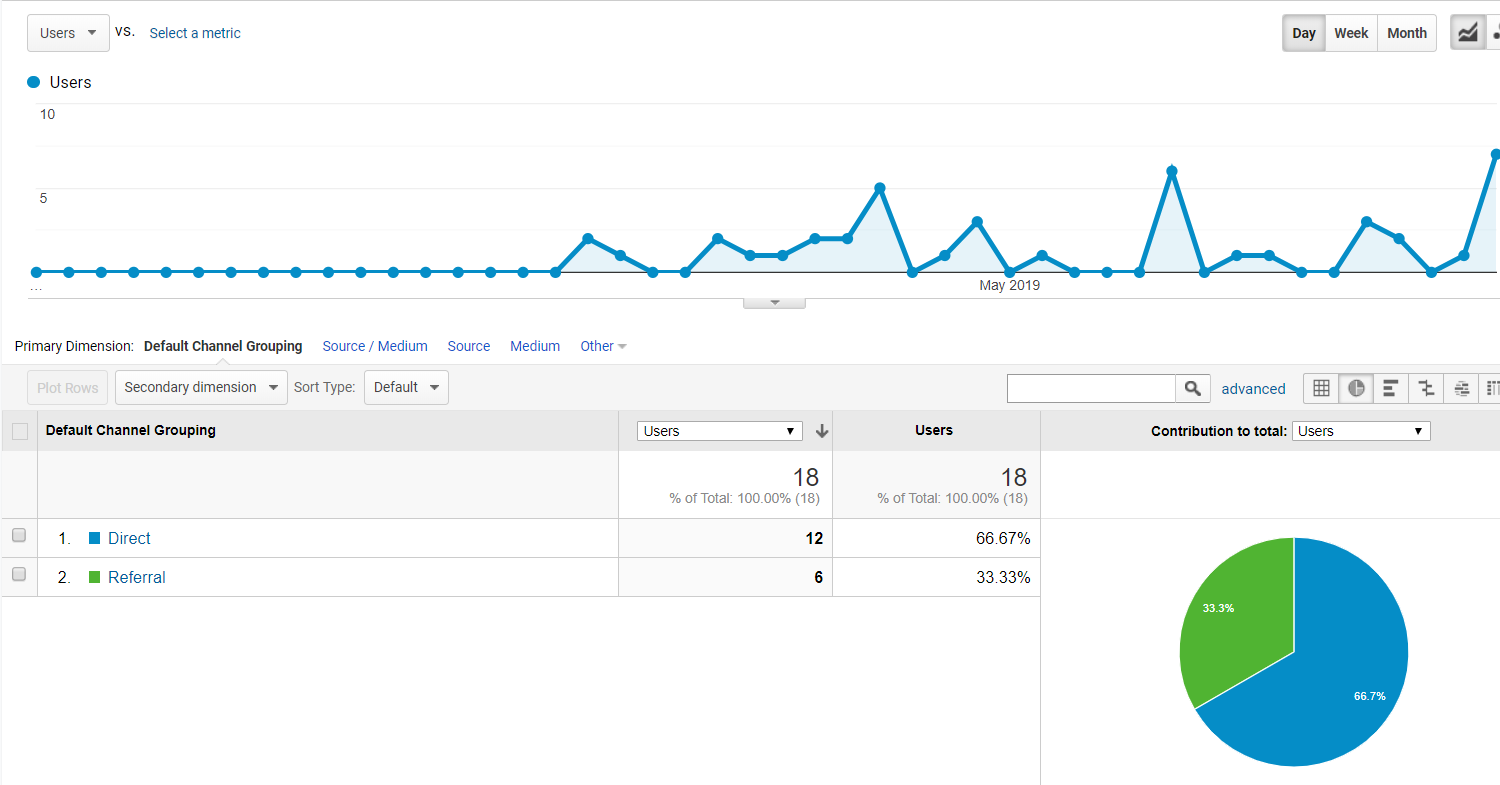 66.7% of users used a Direct Link to visit Post 4
The actual data revealed that 66.7% pecent of users used a direct link to get to the User Journal, while 33.3% percent where reffered to the User Journal. The most viewed post of the User journal was post number 3 with 27.78% percent of users using the direct link for post three to visit the page, 22.2% percent of users visting the User Journal the direct link for post 4 to visit the page.
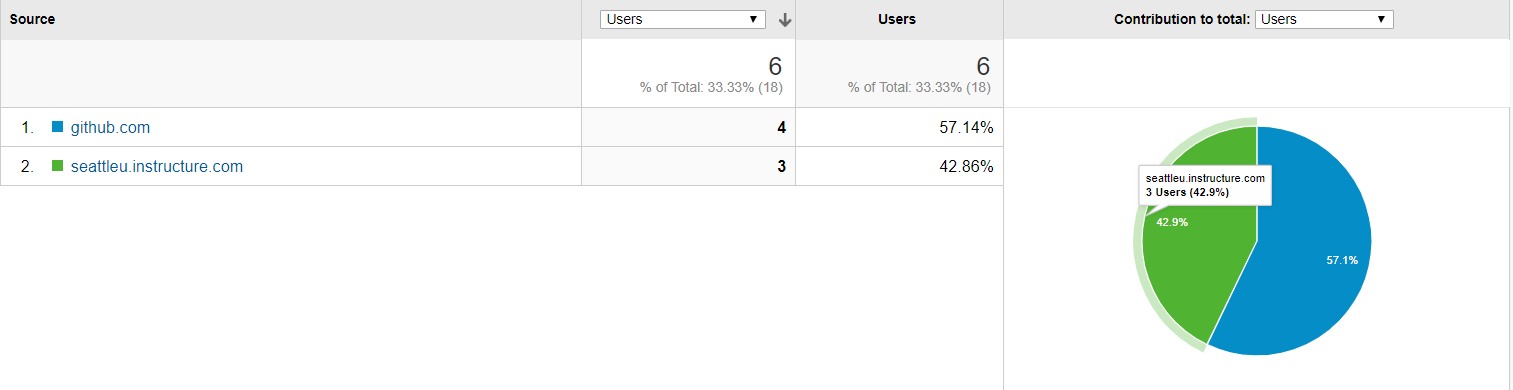 57.14% of users are form Github.com
alt="Image Refferal Channel data used to view User Journal ">
57.14% of users are form Github.com
alt="Image Refferal Channel data used to view User Journal ">
The predicted and actual data are similar. The actual data revealed that users used github.com, and seattleu.instructue to view the User Journal, while there as no data for users using Twitter to reach the User Journal. 57.14% percent of the Users journal used github.com to visit the user journal.